
Copyright © 2015 - 2026 Good Calculators. All Rights Reserved
Widgets Privacy About Us
Simple Moving Average (SMA) Calculator
You can use this straightforward simple moving average (SMA) calculator to calculate the moving average of a data set.
To use the calculator, simply input the data set, separated by line breaks, spaces, or commas, and click on the "Calculate" button.
Results
Moving Average:
Reference
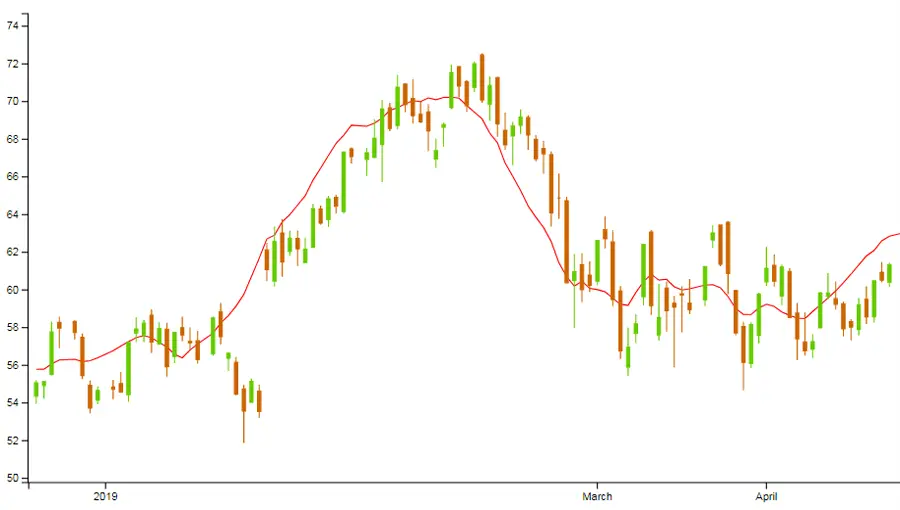
A moving average is marked on a stock chart by a line, and it represents the average price of a given stock over a period of interest. It serves to smooth over the changes in a stock price so that the overall trend becomes more apparent.
The most frequently employed moving averages are the exponential moving average (EMA) and the simple moving average (SMA).
When provided with a sequential data set, you can determine the n-point moving (or rolling) average by computing the mean of each set of n successive points. For instance, if you have the following sequential data set:
2, 4, 6, 8, 12, 14, 16, 18, 20,
the four-point moving average would be as follows:
5, 7.5, 10, 12.5, 15, 17
Moving averages serve to "smooth" chronological data; they reduce the impact of sharp peaks and dips because every raw data point is provided with a fractional weight in the moving average. The higher the value of n, the smoother the moving average graph will be in comparison to a graph of the original data. Stock analysts frequently examine the moving averages of stock prices to identify patterns and predict future movements.
Simple Moving Average Formula
SMA (n) = (P1 + P2 + … + Pn) / n
Where:
n is the number of time periods,
Pn is the price at period n.