
Copyright © 2015 - 2026 Good Calculators. All Rights Reserved
Widgets Privacy About Us
Historical Volatility Calculator
You can use this historical volatility calculator to calculate the historical volatility of stock prices according to a set of provided data. You can also upload Yahoo Finance CSV files to conveniently calculate historical volatility.
How to use the calculator
Choose the calculation approach you want to use, select the lookback period, and complete the daily stock closing price and date for each row. If you need to add an additional row, click on the "Add Row" button. If you would like to see an example of a completed input form, click on the "Example" button. If you have a CSV file available from Yahoo Finance (or Investing.com) that contains the historical price data in CSV format (examples here and here), you can upload it. Click on the "Calculate" button to generate the results.
What Is Historical Volatility?
Historical statistical volatility provides an indication of how the stock price has changed over a given period of time. While some analysts may use historical volatility as a means of predicting future stock performance, it may not necessarily be a correct indication as historical influences may have driven price changes. Furthermore, the stock price is directly influenced by major news items.
Historical volatility can be measured in a myriad of ways. This calculator computes historical volatility using two different approaches:
- The standard deviation of logarithmic returns, which is also referred to as centered historical volatility.
- The zero-mean method, which is also referred to as non-centered historical volatility.
Calculating Logarithmic Returns
To calculate the stock volatility from a set of historical stock price data, you start by determining the daily logarithmic returns, which is known as the continuously compounded return. This is computed as follows:
Ri = ln ( Ci / Ci-1 )
Where:
Ri is the return of a given stock over the period i,
ln is the natural log function,
Ci is the closing price at the end of the period i,
Ci-1 is the closing price at the end of the period immediately before period i.
Standard Deviation of Logarithmic Returns
The standard deviation of logarithmic returns is the most commonly employed method of determining historical volatility. To compute historical volatility using this approach, simply determine the sample standard deviation of n last returns as follows:
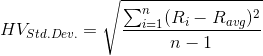
Where:
Ri is the return of a given stock over the period i,
Ravg is the average of all the daily returns, Ravg = (1/n) Σi=1...n Ri
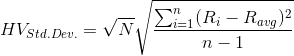
The formula above is applicable for 1-period historical volatility. Volatility is usually computed and cited in annualized form. To annualize 1-period of volatility, simply multiply it by the square root of the number of periods per year (N). For instance, if there were 252 trading days in the year, the annualized volatility will be computed as the 1-day volatility multiplied by the square root of 252. Annualized historical volatility is thus determined as follows:
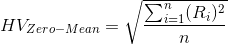
The Zero-Mean Approach
The zero-mean approach represents a modified form of the standard deviation method. Historical volatility is the standard deviation of returns; however, the average return (Ravg) is assumed to be zero. As such, the formula is modified as follows:
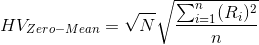
The annualized historical volatility is computed as follows:
You may also be interested in our Black-Scholes Calculator or RSI Calculator