Gini Coefficient Calculator
This Gini coefficient calculator can be employed for swift and simple computations of the Gini coefficient for any specified income distribution.
How to use the calculator: Enter a set of incomes separated by commas, line breaks, or spaces, and click on the "Calculate" button.
Reference
The Gini coefficient, named for the Italian statistician Corrado Gini, represents a dimensionless measurement of statistical dispersion that is often employed to analyze income distribution.
This coefficient, G, of a data set or income distribution curve has a range between 0 and 1, 0 being where wealth is most equally distributed (with every individual owning the same sized share) and 1 being where wealth is most unequally distributed (one individual owns everything).
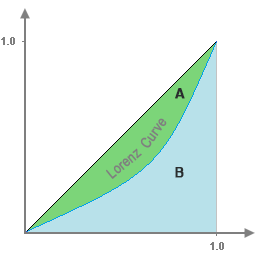
Mathematically, G is the ratio of the area between the wealth distribution curve (Lorenz curve) and the line of equal distribution (straight line) to the entire area under the line of equal distribution; i.e., G = A / (A + B). It is easiest to show this as a graph:

A Lorenz curve represents the way in which wealth is cumulatively distributed, with the quantity of wealth held by individuals put in order from smallest to largest. Any given (x, y) point on this curve represents x percent of the population owning y percent of wealth.
For reference, in 1992, the U.S. Gini coefficient for household income was 0.433. Twenty six years later, by 2018, the Gini coefficient rose to 0.49.
Computing the Gini Coefficient (Empirical Distribution)
With an empirical Lorenz curve that has been generated using discrete data points, the Gini coefficient may be calculated using the formula:

with Xi being ordered from smallest to largest.
Computing the Gini Coefficient (Theoretical Distribution)
If the Lorenz curve is represented with the function f(x) over the interval [0, 1], the Gini coefficient may be calculated using integration, employing this formula:

